
FL
Punta Gorda
$483,892
$367,871
1,988
64,354
1,281 Properties for Sale In Punta Gorda
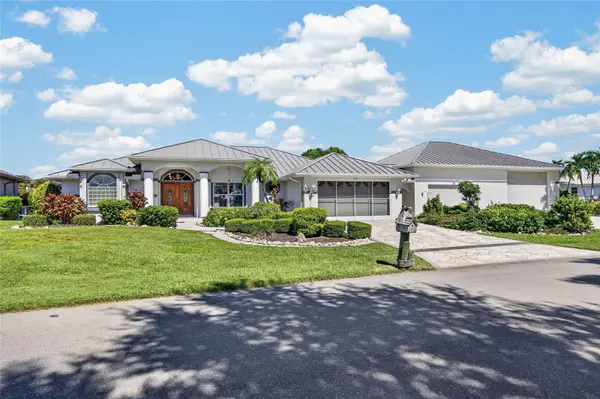 3 Beds3 Baths2,488 SqFt1/59 59New
$1,000,000
112 GREAT ISAAC CT, Punta Gorda, FL 33950
Listed by Christopher Grant GRANT TEAM REAL ESTATE, LLC

 3 Beds3 Baths2,763 SqFt1/31 31New
$979,900
3712 WHIPPOORWILL BLVD, Punta Gorda, FL 33950
Listed by Shelly Fuhrhop, LLC EPIQUE REALTY INC.
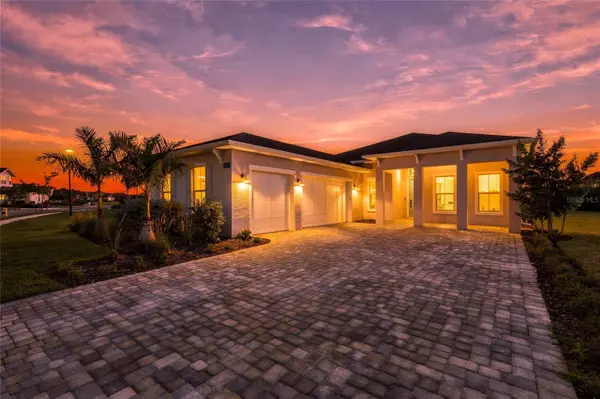 3 Beds4 Baths2,530 SqFt1/34 34New
$725,000
16365 PRESERVATION BLVD, Punta Gorda, FL 33982
Listed by Margaret Troup TROUP REAL ESTATE LLC
 4 Beds3 Baths2,555 SqFt1/4 4New
 4 Beds3 Baths2,555 SqFt1/4 4New
 4 Beds3 Baths2,088 SqFt1/31 31New
$438,390
13716 EVERBREEZE LN, Punta Gorda, FL 33955
Listed by Nancy Pruitt, PA OLYMPUS EXECUTIVE REALTY INC
 3 Beds2 Baths1,618 SqFt3DNew
 2 Beds2 Baths1,198 SqFt1/63 63New
$249,000
14091 HERITAGE LANDING BLVD #127, Punta Gorda, FL 33955
Listed by Joe Crimaldi CRIMALDI & ASSOCIATES, LLC
 5 Beds5 Baths5,310 SqFt1/97 97New
 3 Beds4 Baths2,358 SqFt1/56 56New
$1,400,000
1362 JACANA CT, Punta Gorda, FL 33950
Listed by Christopher Grant GRANT TEAM REAL ESTATE, LLC
 2 Beds2 Baths1,515 SqFt3DNew
 2 Beds2 Baths1,620 SqFt1/58 58Pending
$339,000
2001 KING TARPON DR, Punta Gorda, FL 33955
Listed by William Fuchs REALTY GROUP OF SW FLORIDA INC
 3 Beds2 Baths1,835 SqFt1/68 68New
 4 Beds2 Baths2,304 SqFt1/56 56New
 3 Beds2 Baths1,426 SqFt1/35 35New
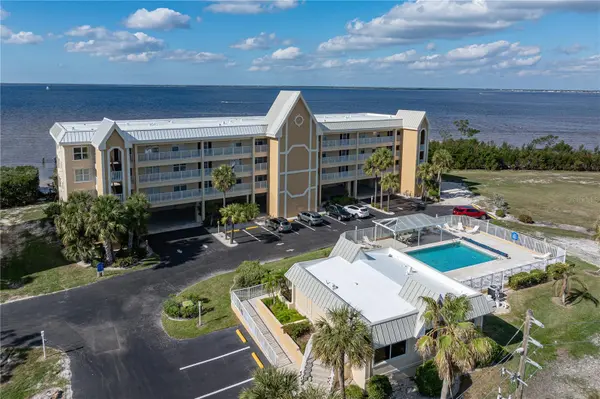 3 Beds2 Baths1,592 SqFt1/59 59New
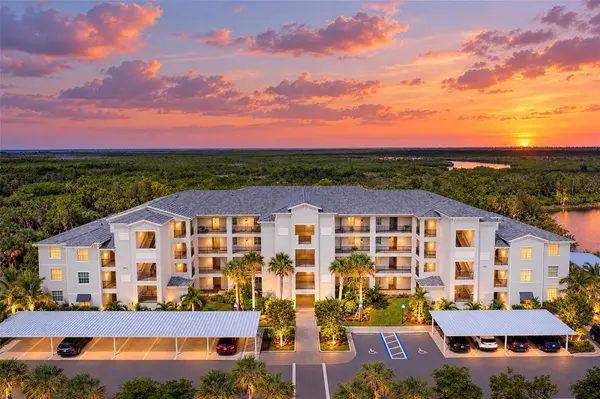 2 Beds2 Baths1,198 SqFt1/45 45New
$239,000
14161 HERITAGE LANDING BLVD #1132, Punta Gorda, FL 33955
Listed by Cynthia Martin CALENDA REAL ESTATE GROUP,INC.
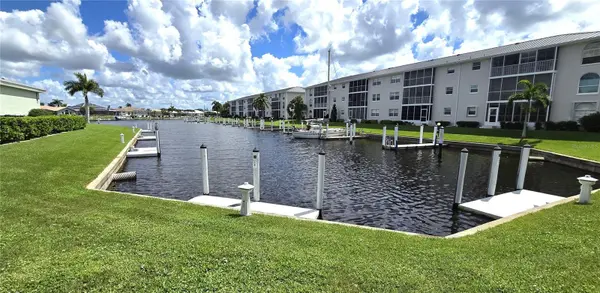 2 Beds2 Baths1,089 SqFt1/37 37New
$195,000
3600 BAL HARBOR BLVD #1-O, Punta Gorda, FL 33950
Listed by Denise Henry RE/MAX ALLIANCE GROUP
 2 Beds2 Baths1,104 SqFt1/42 42New
 2 Beds2 Baths1,223 SqFt1/37 37New
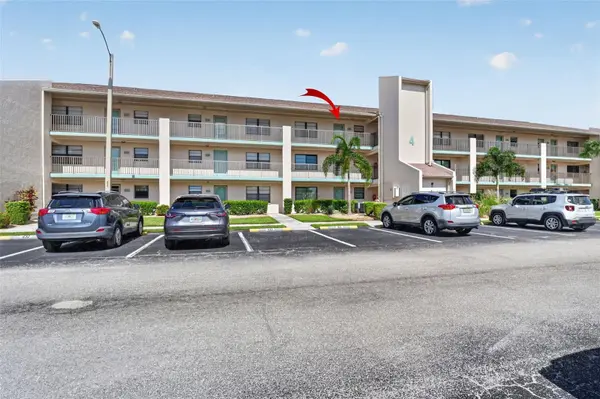 2 Beds2 Baths1,153 SqFt1/22 22New
 4 Beds5 Baths3,900 SqFt1/43 43New
$2,995,000
5447 SEA EDGE DR, Punta Gorda, FL 33950
Listed by Teresa Halliburton CENTURY 21 SUNBELT REALTY
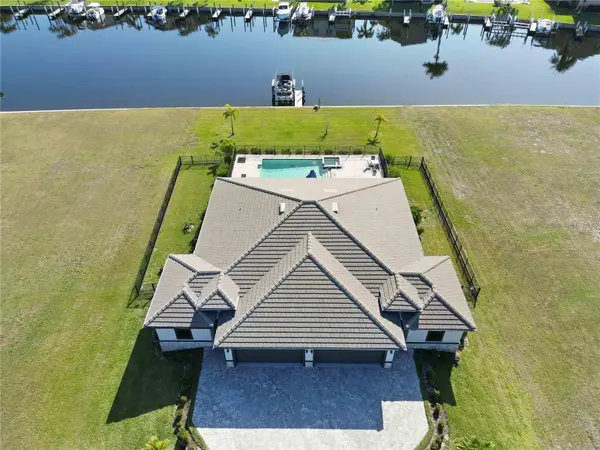 669 Beds446 Baths2,898 SqFt1/37 37New
$1,399,000
3240 WOODTHRUSH DR #111 & 112, Punta Gorda, FL 33950
Listed by Brandy Loebker KELLER WILLIAMS ISLAND LIFE REAL ESTATE
 3 Beds2 Baths2,214 SqFt3DActive Under Contract
$795,000
472 MACEDONIA DR, Punta Gorda, FL 33950
Listed by Ken Williams FIVE STAR REALTY OF CHARLOTTE
explore listings in Punta Gorda
RECENT LISTINGS
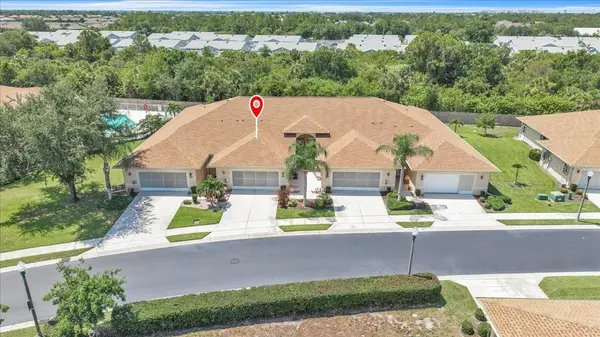
Listing Provided By SELLSTATE VISION REALTY

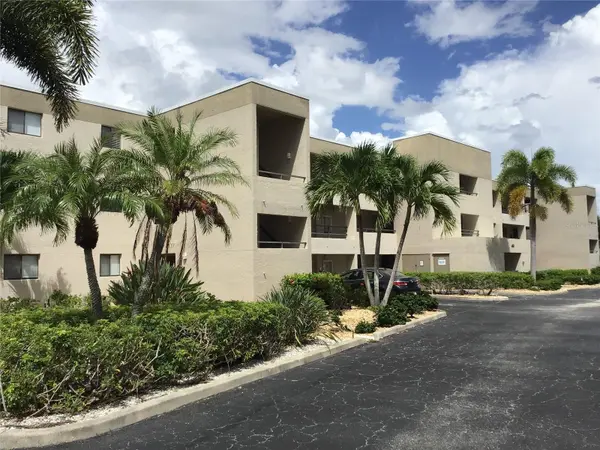
Listing Provided By JOHN R WOOD PROPERTIES

Punta Gorda Market Statistics
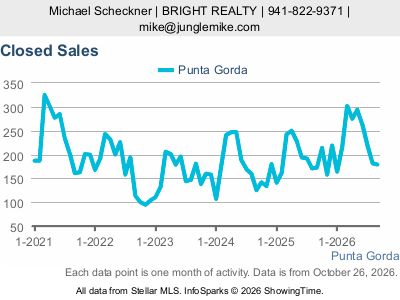
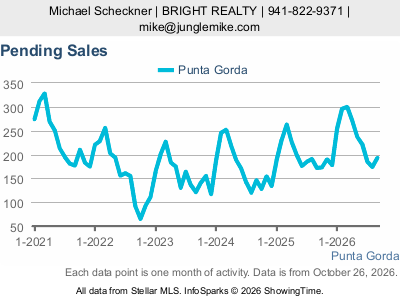
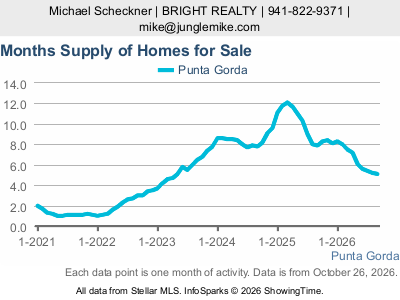
Explore the latest complete month of Punta Gorda city residential market data, with five years of monthly history. These live charts update automatically as Stellar MLS releases new data.
Closed Sales
Pending Sales
Homes for Sale
Months Supply
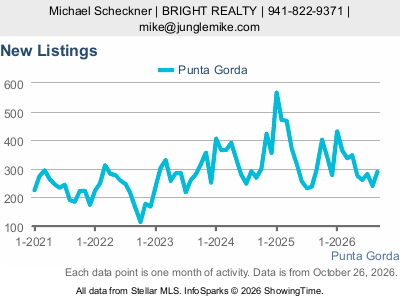
New Listings
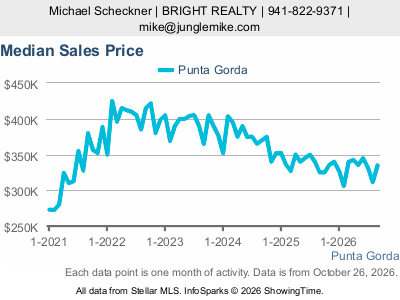
Median Sales Price
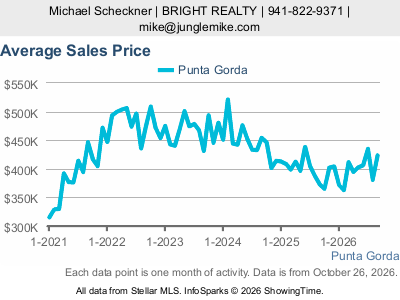
Average Sales Price
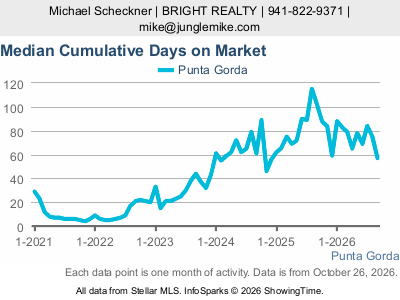
Median Cumulative Days on Market
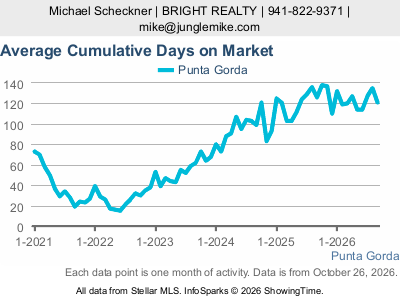
Average Cumulative Days on Market
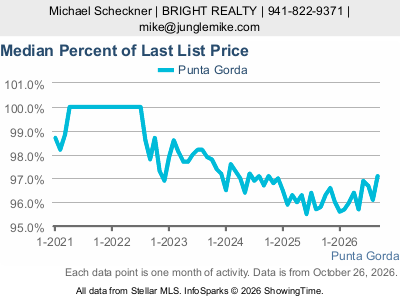
Median Percent of Last List Price
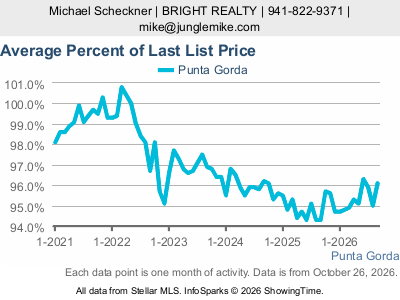
Average Percent of Last List Price
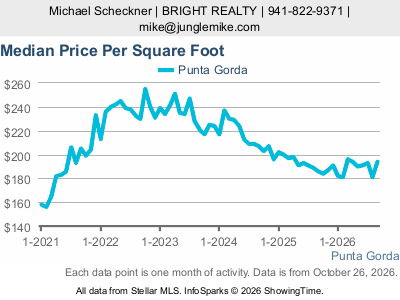
Median Sale Price Per Square Foot
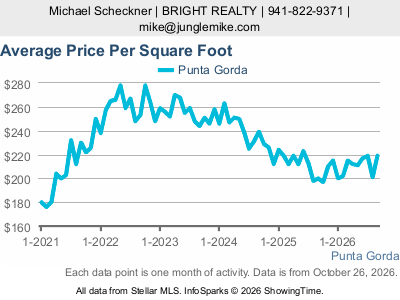
Average Sale Price Per Square Foot
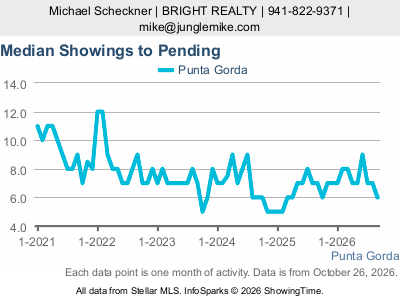
Median Showings to Pending
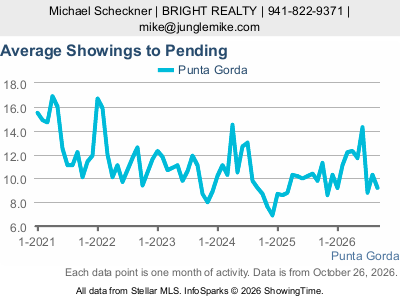
Average Showings to Pending
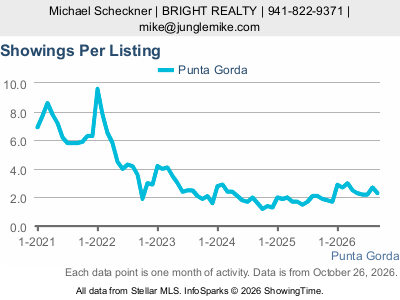
Showings Per Listing
Dollar Volume of Closed Sales
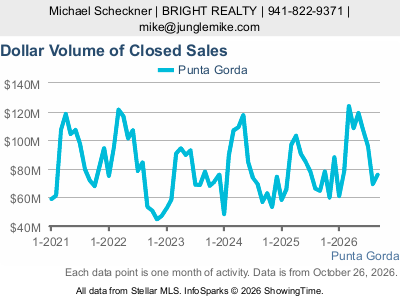
Source: Stellar MLS / InfoSparks by ShowingTime. Punta Gorda city; all available residential property types and price ranges. Each chart displays its current reporting period. CDOM means cumulative days on market. Sale-to-list percentages use the last list price. Showing activity reflects listings tracked by ShowingTime; showings-to-pending measures activity before a listing goes pending. Dollar volume is the total value of closed sales. These measures differ from the former SmartCharts gauges.
MARKET TRENDS

housing detail

Coming Soon
Listing Detail
Nearby Locations
10303 Burnt Store RD #97, Punta Gorda, FL 33950
2 Beds 2 Baths 1,032 SqFt
Other Types
Listed by Gulf Coast Living Real Estate, Inc26193 SACRED LOTUS LN, Punta Gorda, FL 33955
3 Beds 2 Baths 1,614 SqFt
Single Family Home
Listed by Matthew Patterson KW PEACE RIVER PARTNERS
16133 Shoreline DR, Punta Gorda, FL 33982
3 Beds 4 Baths 3,003 SqFt
Other Types
Listed by Decatur Real Estate Group10499 PRINCESS CT, Punta Gorda, FL 33955
2 Beds 2 Baths 1,753 SqFt
Single Family Home
Listed by Kurt Havel ALLISON JAMES ESTATES & HOMES26029 LUZON CT, Punta Gorda, FL 33983
3 Beds 2 Baths 1,566 SqFt
Single Family Home
Listed by Karen Albright OPENDOOR BROKERAGE LLC13464 Turnleaf BLVD, Punta Gorda, FL 33955
4 Beds 3 Baths 2,235 SqFt
Other Types
Listed by Olympus Executive Realty43014 Parkside CT, Punta Gorda, FL 33982
2 Beds 2 Baths 1,861 SqFt
Other Types
Listed by Premiere Plus Realty Company17323 Peregrine WAY, Punta Gorda, FL 33982
3 Beds 3 Baths 1,648 SqFt
Other Types
Listed by Blue Line Realty of SWFL17319 Peregrine WAY, Punta Gorda, FL 33982
3 Beds 3 Baths 1,704 SqFt
Other Types
Listed by Blue Line Realty of SWFL201 TROPICANA DR, Punta Gorda, FL 33950
3 Beds 5 Baths 3,738 SqFt
Single Family Home
Listed by Darcy Hanley COLDWELL BANKER SUNSTAR REALTY801 ROYAL POINCIANA, Punta Gorda, FL 33955
3 Beds 2 Baths 2,201 SqFt
Single Family Home
Listed by Matt Strauss BRIGHT REALTY17327 Peregrine WAY, Punta Gorda, FL 33982
3 Beds 3 Baths 1,572 SqFt
Other Types
Listed by Blue Line Realty of SWFL17331 Peregrine WAY, Punta Gorda, FL 33982
3 Beds 3 Baths 1,737 SqFt
Other Types
Listed by Blue Line Realty of SWFL17123 BARCREST LN, Punta Gorda, FL 33955
3 Beds 3 Baths 1,914 SqFt
Single Family Home
Listed by Kurt Havel ALLISON JAMES ESTATES & HOMES16030 Palos Verdes ST, Punta Gorda, FL 33982
3 Beds 2 Baths 1,429 SqFt
Other Types
Listed by Absolute Equity Realty Group L95 N MARION CT #226, Punta Gorda, FL 33950
3 Beds 2 Baths 2,153 SqFt
Condo
Listed by Tamina Aratari COMPASS FLORIDA LLC16880 COTTONTAIL CIR, Punta Gorda, FL 33982
3 Beds 3 Baths 1,971 SqFt
Other Types
Listed by Olympus Executive Realty16940 Cottontail CIR, Punta Gorda, FL 33982
3 Beds 2 Baths 1,797 SqFt
Other Types
Listed by Olympus Executive Realty17042 Cottontail CIR, Punta Gorda, FL 33982
4 Beds 3 Baths 2,022 SqFt
Other Types
Listed by Olympus Executive Realty109 DOLLY ST, Punta Gorda, FL 33950
2 Beds 3 Baths 1,127 SqFt
Single Family Home
Listed by Ashley Harris REAL BROKER, LLC
Commute Score
Coming Soon
demographics
Population
Density
Households
Gender
Coming Soon
Education
Coming Soon
Coming Soon
Coming Soon
Coming Soon

GET MORE INFORMATION