
FL
North Port
$371,238
$329,882
1,117
62,061
970 Properties for Sale In North Port
 4 Beds2 Baths2,240 SqFt1/2 2Active
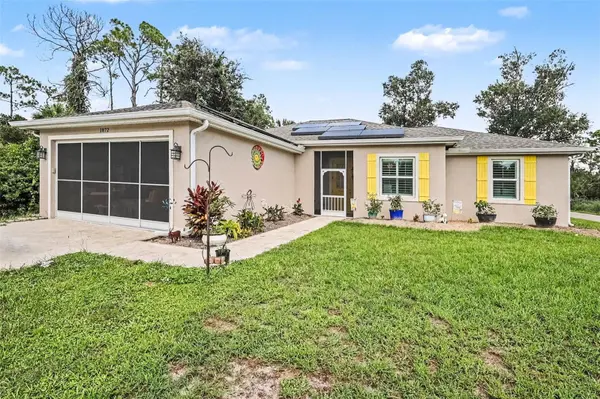 3 Beds2 Baths1,559 SqFt1/37 37Pending
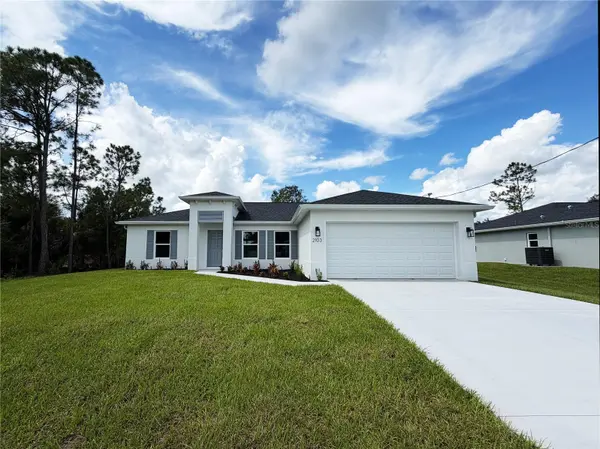 3 Beds2 Baths1,437 SqFt1/35 35Active
$325,000
2103 SWITZERLAND RD, North Port, FL 34288
Listed by Catherine Mitchell GULFSTAR REAL ESTATE SERVICES

 3 Beds2 Baths1,830 SqFt1/24 24Active Under Contract
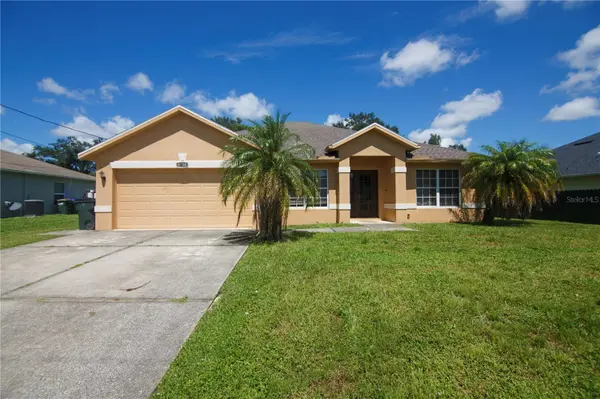 3 Beds2 Baths1,499 SqFt1/30 30Active
 2 Beds2 Baths1,168 SqFt1/31 31Active
$220,000
5762 SABAL TRACE DR #201, North Port, FL 34287
Listed by Allie Duenas, PA RE/MAX ALLIANCE GROUP
 2 Beds1 Bath1,062 SqFt3DActive
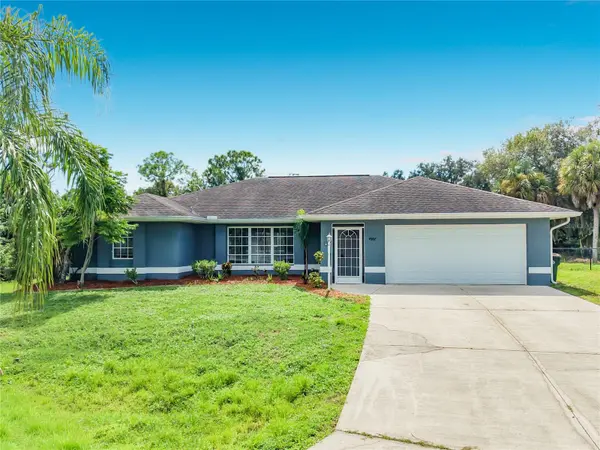 3 Beds2 Baths2,556 SqFt1/39 39Active
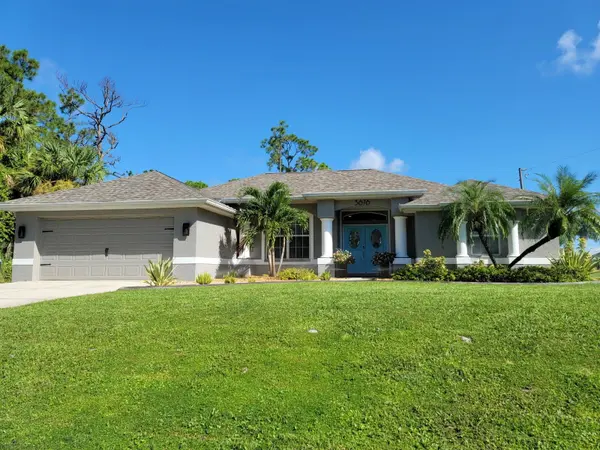 3 Beds3 Baths2,062 SqFt1/57 57Pending
 4 Beds2 Baths1,585 SqFt1/51 51Active
$360,000
433 GRANADA BLVD, North Port, FL 34287
Listed by Regina Melman RE/MAX PALM REALTY OF VENICE
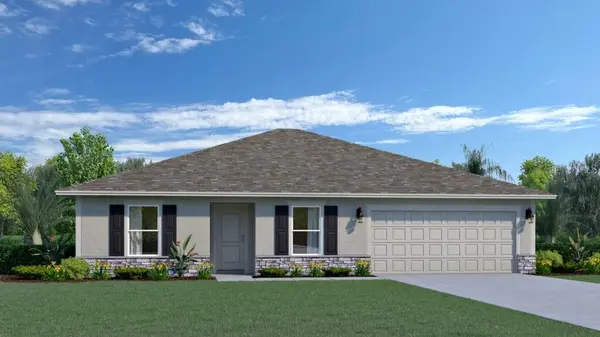 4 Beds2 Baths1,602 SqFt1/2 2Active
 3 Beds2 Baths1,506 SqFt1/54 54Active
$314,900
1888 FRANKLIN LN, North Port, FL 34286
Listed by Debbie Bennice COLDWELL BANKER SUNSTAR REALTY
 3 Beds2 Baths1,563 SqFt1/40 40Active
$305,000
3073 TULSA AVE, North Port, FL 34286
Listed by William Figueroa SOVEREIGN REAL ESTATE GROUP
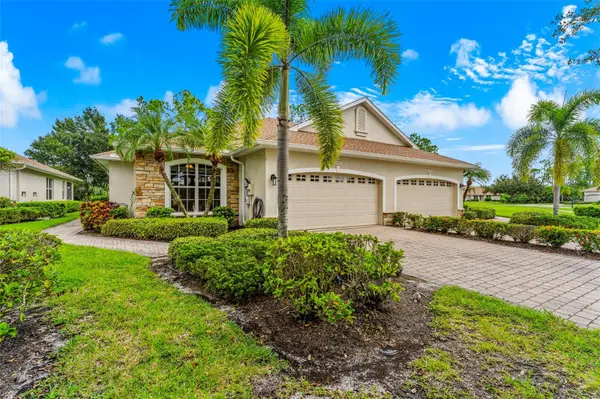 2 Beds2 Baths1,448 SqFt1/63 63Active
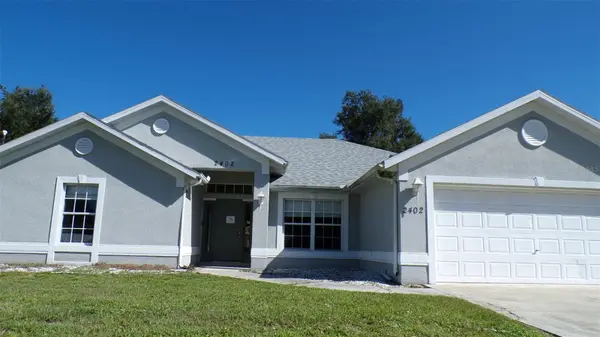 4 Beds3 Baths2,110 SqFt1/19 19Pending
 3 Beds2 Baths1,741 SqFt1/36 36Active
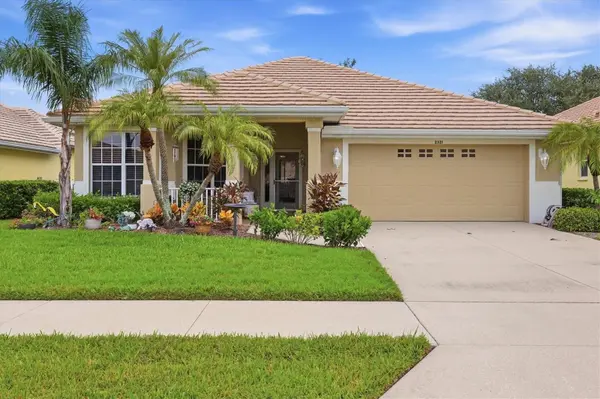 3 Beds2 Baths1,681 SqFt1/35 35Active
 2 Beds2 Baths1,471 SqFt1/32 32Active
 3 Beds2 Baths1,385 SqFt1/18 18Pending
$259,900
1866 BOCA CHICA AVE, North Port, FL 34286
Listed by Kristen Conti, PA PEACOCK PREMIER PROPERTIES LLC
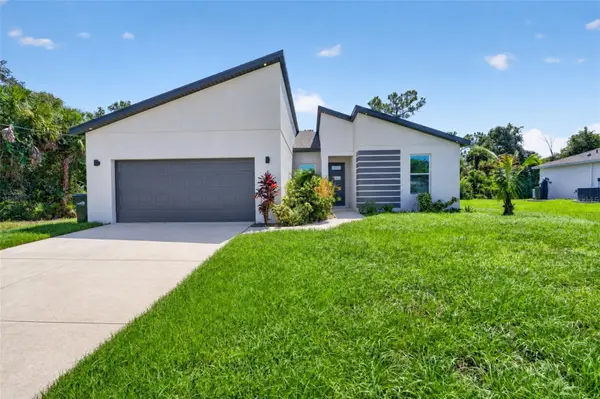 4 Beds2 Baths1,718 SqFt1/31 31Active
$340,000
5663 GREENHOUSE AVE, North Port, FL 34288
Listed by Maria Elena Perez MEP REALTY INVESTMENTS LLC
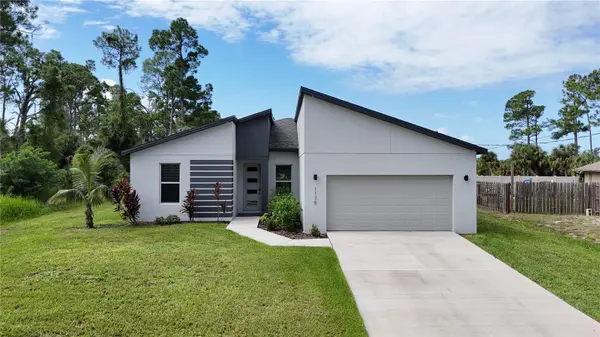 4 Beds2 Baths1,718 SqFt3DPending
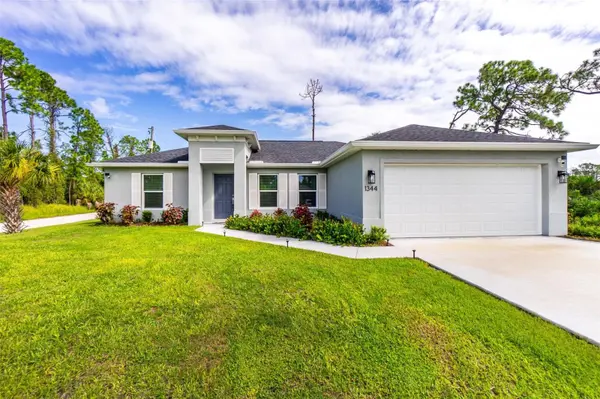 3 Beds2 Baths1,436 SqFt1/55 55Active Under Contract
 2 Beds2 Baths1,168 SqFt1/48 48Active
$234,900
5767 SABAL TRACE DR #104, North Port, FL 34287
Listed by Allen Ramsey, Jr. GULF SHORES REALTY ERA POWERED
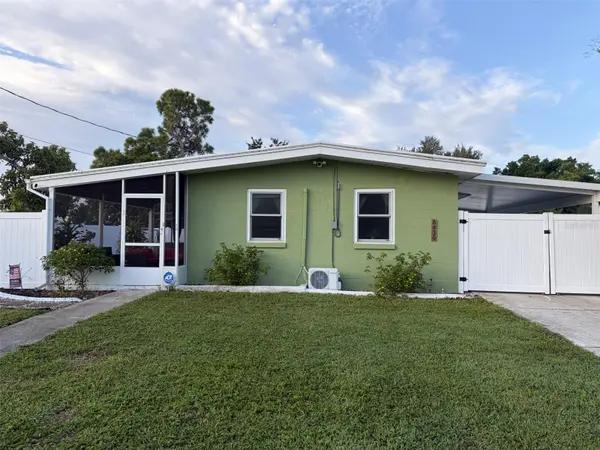 1 Bed1 Bath588 SqFt1/22 22Active
explore listings in North Port
RECENT LISTINGS
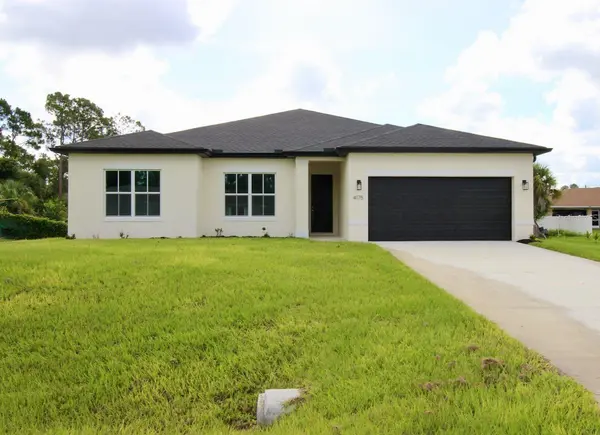
Listing Provided By EQUITY CENTRAL FLORIDA RE. LLC

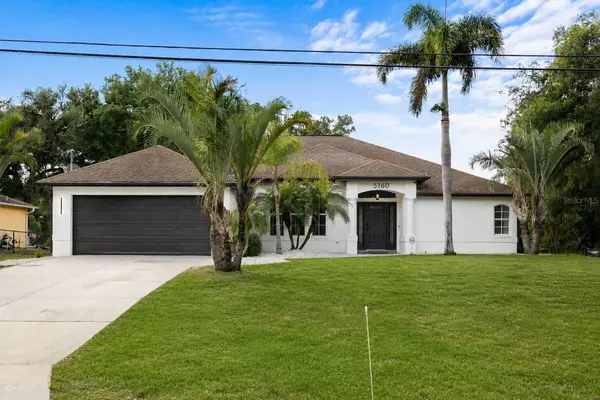
Listing Provided By CALL IT CLOSED INTL REALTY
North Port Market Statistics
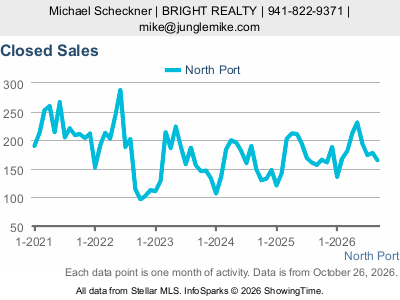
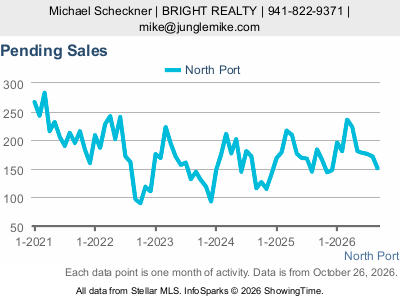
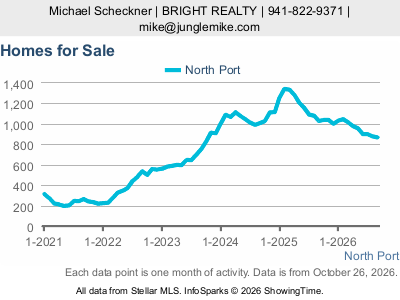
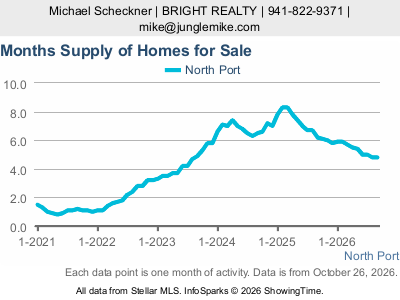
Explore the latest complete month of North Port city residential market data, with five years of monthly history. These live charts update automatically as Stellar MLS releases new data.
Closed Sales
Pending Sales
Homes for Sale
Months Supply
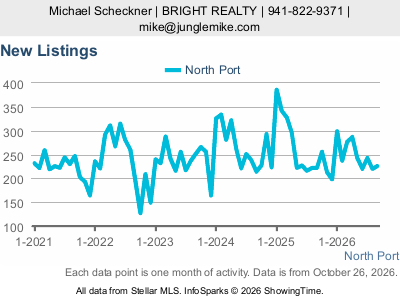
New Listings
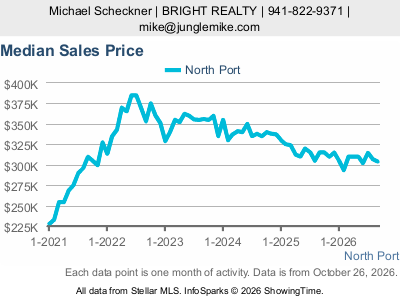
Median Sales Price
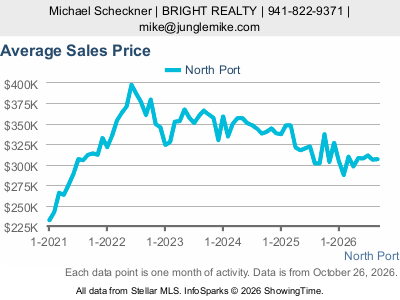
Average Sales Price
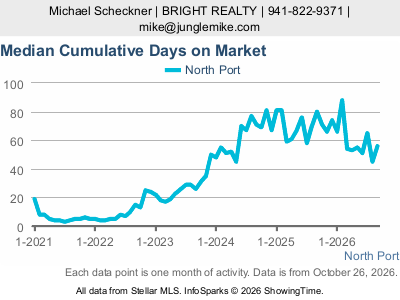
Median Cumulative Days on Market
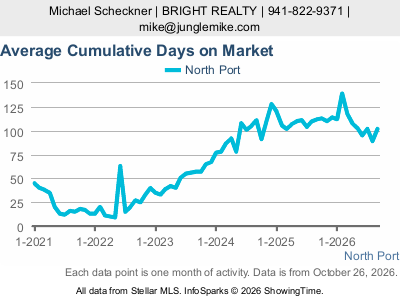
Average Cumulative Days on Market
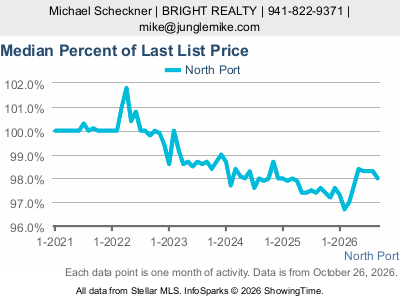
Median Percent of Last List Price
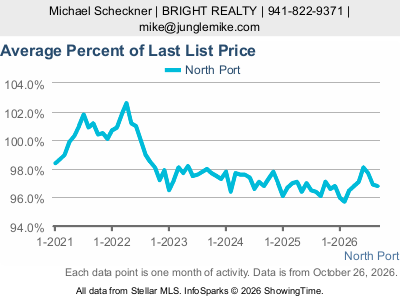
Average Percent of Last List Price
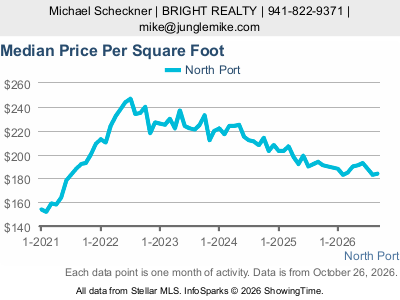
Median Sale Price Per Square Foot
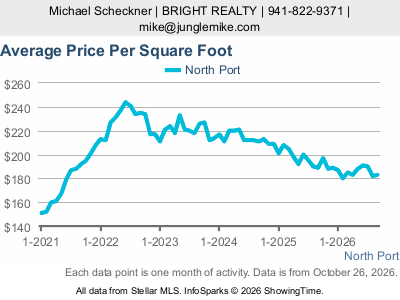
Average Sale Price Per Square Foot
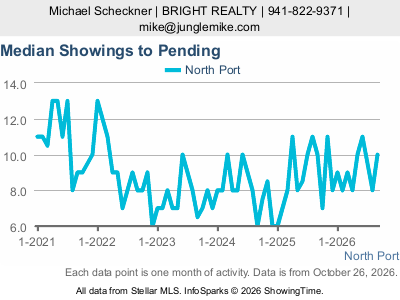
Median Showings to Pending
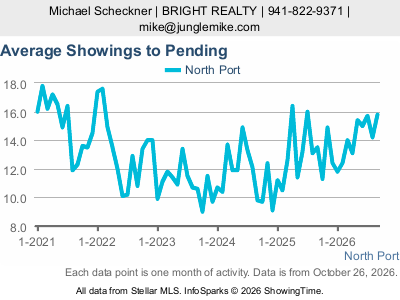
Average Showings to Pending
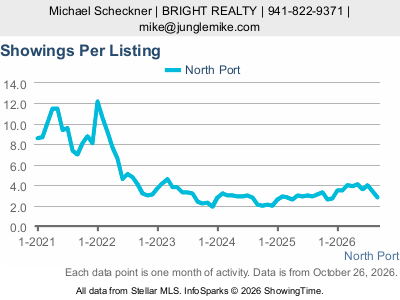
Showings Per Listing
Dollar Volume of Closed Sales
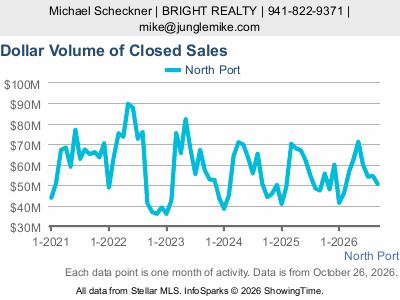
Source: Stellar MLS / InfoSparks by ShowingTime. North Port city; all available residential property types and price ranges. Each chart displays its current reporting period. CDOM means cumulative days on market. Sale-to-list percentages use the last list price. Showing activity reflects listings tracked by ShowingTime; showings-to-pending measures activity before a listing goes pending. Dollar volume is the total value of closed sales. These measures differ from the former SmartCharts gauges.
MARKET TRENDS

housing detail

Coming Soon
Listing Detail
Nearby Locations
403 VIVAR, North Port, FL 34287
2 Beds 2 Baths 1,055 SqFt
Other Types
Listed by Tammie Schroder LA CASA REAL ESTATE INC.
1150 KNOTTY PINE AVE, North Port, FL 34288
3 Beds 2 Baths 1,852 SqFt
Single Family Home
Listed by Michelle Brenner FINE PROPERTIES2450 SILVER PALM RD, North Port, FL 34288
3 Beds 2 Baths 1,992 SqFt
Single Family Home
Listed by Barbara Brunner COLDWELL BANKER SUNSTAR REALTY417 VILLA NUEVA CIR, North Port, FL 34287
2 Beds 2 Baths 1,144 SqFt
Other Types
Listed by Tammie Schroder LA CASA REAL ESTATE INC.124 SAN BENITO AVE, North Port, FL 34287
3 Beds 2 Baths 1,476 SqFt
Single Family Home
Listed by Karen Albright OPENDOOR BROKERAGE LLC653 LOS ALTOS, North Port, FL 34287
2 Beds 2 Baths 1,008 SqFt
Other Types
Listed by Tammie Schroder LA CASA REAL ESTATE INC.248 LA ROSAS, North Port, FL 34287
2 Beds 2 Baths 1,200 SqFt
Other Types
Listed by Tammie Schroder LA CASA REAL ESTATE INC.1458 E HALLMARK BLVD, North Port, FL 34288
3 Beds 3 Baths 1,714 SqFt
Single Family Home
Listed by Judit Turan EXIT KING REALTY1741 SHEVLIN ST, North Port, FL 34286
3 Beds 2 Baths 1,858 SqFt
Single Family Home
Listed by Jason R. White, PA WHITE SANDS REALTY GROUP FL4418 PONCE DE LEON BLVD, North Port, FL 34291
4 Beds 2 Baths 1,810 SqFt
Single Family Home
Listed by Kathie McDaniel GRANDE REAL ESTATE SERVICES209 VISTORIA DR, North Port, FL 34287
3 Beds 2 Baths 1,720 SqFt
Other Types
Listed by Tammie Schroder LA CASA REAL ESTATE INC.236 WOLVERINE AVE, North Port, FL 34287
2 Beds 3 Baths 875 SqFt
Other Types
Listed by Myra Eagle EXP REALTY LLC485 LOMA LINDA, North Port, FL 34287
2 Beds 2 Baths 1,144 SqFt
Other Types
Listed by Tammie Schroder LA CASA REAL ESTATE INC.424 TARDE LOGO CIR, North Port, FL 34287
2 Beds 2 Baths 1,104 SqFt
Other Types
Listed by Tammie Schroder LA CASA REAL ESTATE INC.618 IGLESIA DR, North Port, FL 34287
2 Beds 2 Baths 1,008 SqFt
Other Types
Listed by Tammie Schroder LA CASA REAL ESTATE INC.320 LA COSTA, North Port, FL 34287
2 Beds 2 Baths 1,151 SqFt
Other Types
Listed by Tammie Schroder LA CASA REAL ESTATE INC.220 LA ROSAS, North Port, FL 34287
2 Beds 2 Baths 1,100 SqFt
Other Types
Listed by Tammie Schroder LA CASA REAL ESTATE INC.512 LA PLAYA CIR, North Port, FL 34287
2 Beds 2 Baths 1,529 SqFt
Other Types
Listed by Tammie Schroder LA CASA REAL ESTATE INC.407 MADONNA, North Port, FL 34287
2 Beds 2 Baths 1,315 SqFt
Other Types
Listed by Tammie Schroder LA CASA REAL ESTATE INC.666 ALVARADO, North Port, FL 34287
2 Beds 2 Baths 1,232 SqFt
Other Types
Listed by Tammie Schroder LA CASA REAL ESTATE INC.
Commute Score
Coming Soon
demographics
Population
Density
Households
Gender
Coming Soon
Education
Coming Soon
Coming Soon
Coming Soon
Coming Soon

GET MORE INFORMATION