
FL
Ellenton
$317,924
$239,900
107
11,295
48 Properties for Sale In Ellenton
 3 Beds2 Baths1,732 SqFt1/47 47Open 10/25 12PM-3PM
 4 Beds3 Baths2,258 SqFt1/50 50Open 10/25 12:30PM-3PM
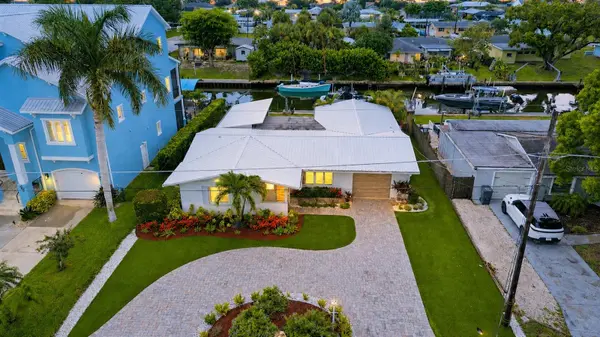 3 Beds2 Baths1,857 SqFt3DOpen 11/8 1PM-3PM
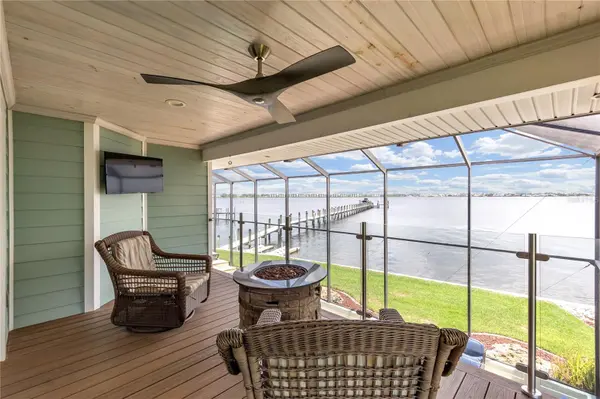 5 Beds4 Baths4,282 SqFt3DOpen 10/25 12PM-3PM
 4 Beds4 Baths2,925 SqFt1/38 38New
 4 Beds3 Baths2,492 SqFt1/52 52Active
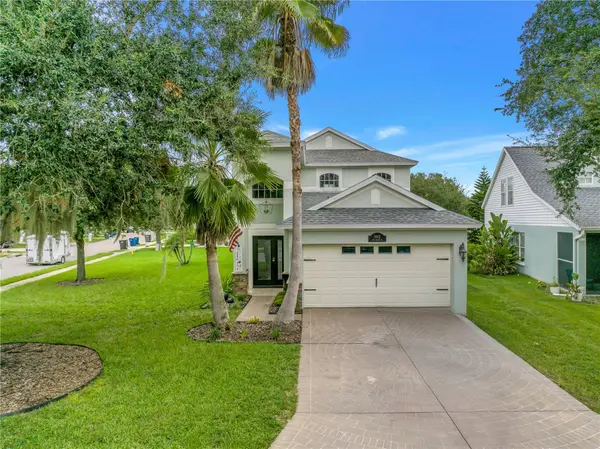 3 Beds3 Baths1,624 SqFt1/63 63Active
 3 Beds2 Baths1,905 SqFt1/44 44Active Under Contract
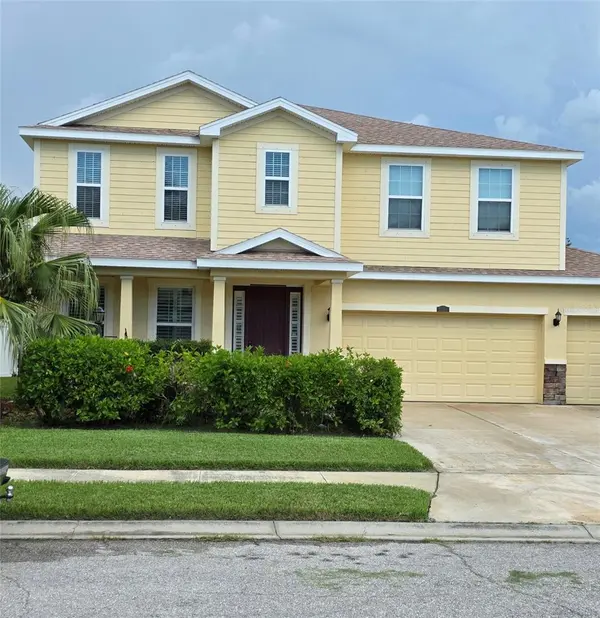 4 Beds3 Baths2,697 SqFt1/5 5Active
 2 Beds2 Baths1,185 SqFt1/40 40Active
 5 Beds3 Baths3,584 SqFt1/5 5Active
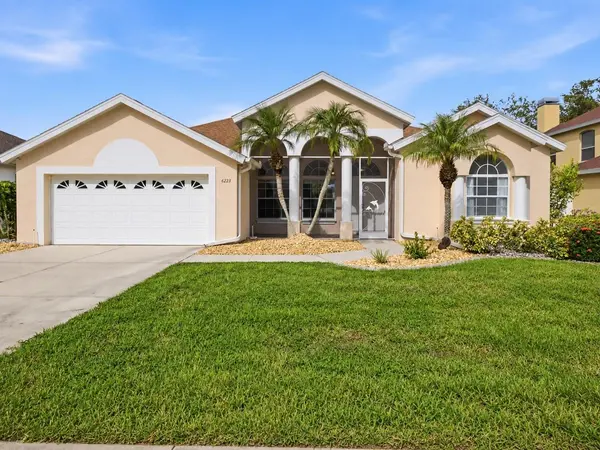 3 Beds2 Baths2,206 SqFt1/59 59Active
$374,999
6223 ROCK CREEK CIR, Ellenton, FL 34222
Listed by Amanda LeGault KELLER WILLIAMS ON THE WATER S

 3 Beds2 Baths2,042 SqFt1/50 50Active
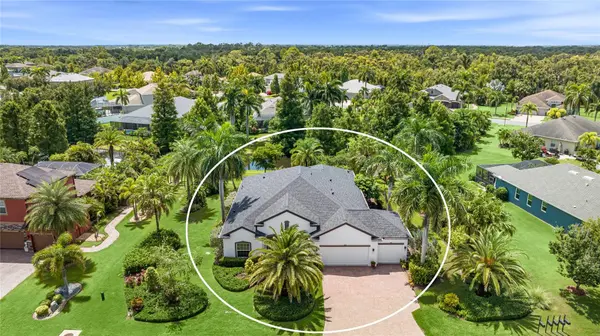 4 Beds4 Baths2,716 SqFt3DActive Under Contract
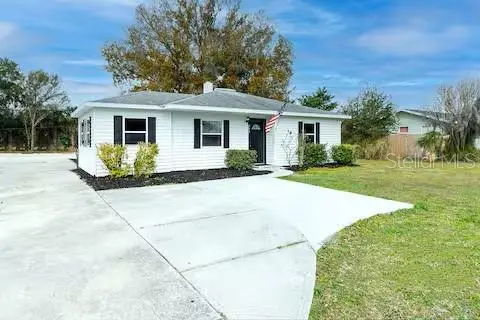 3 Beds2 Baths1,190 SqFt1/41 41Active
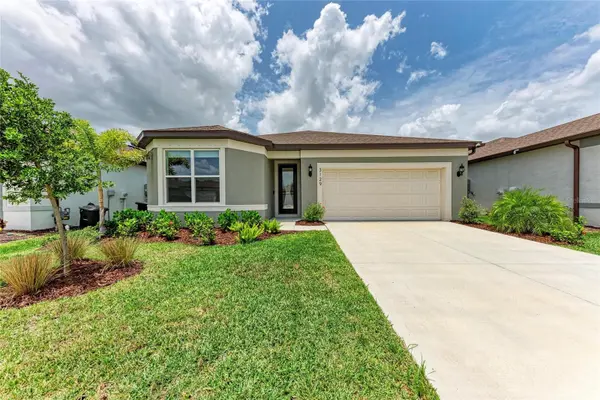 3 Beds2 Baths1,693 SqFt1/30 30Active
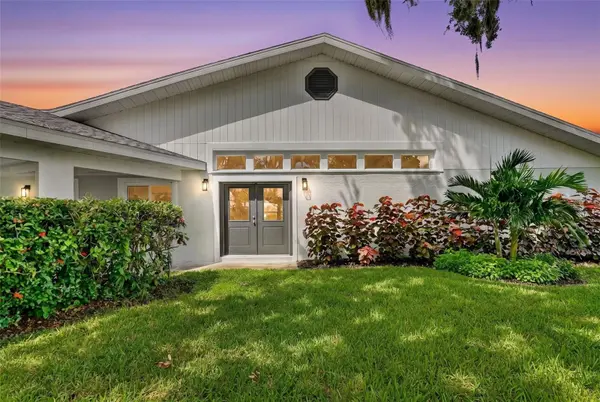 3 Beds2 Baths2,500 SqFt1/65 65Active
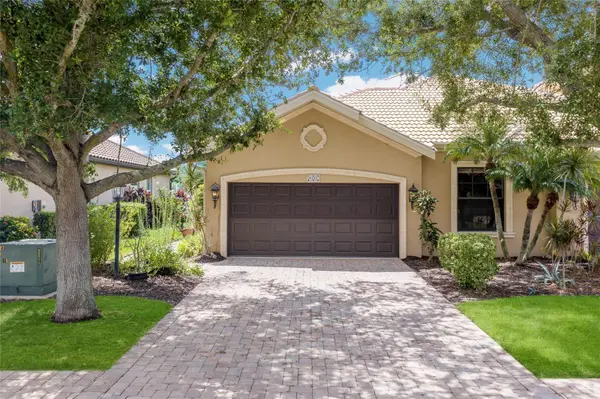 2 Beds2 Baths1,758 SqFt1/41 41Active
 4 Beds3 Baths2,468 SqFt1/98 98Active
 3 Beds3 Baths2,258 SqFt1/83 83Active Under Contract
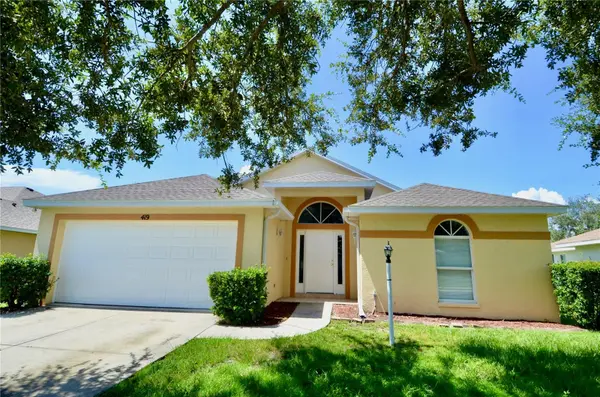 3 Beds2 Baths1,750 SqFt1/33 33Active
 4 Beds3 Baths3,235 SqFt1/73 73Active
 4 Beds2 Baths1,840 SqFt1/26 26Active
 4 Beds3 Baths2,492 SqFt1/40 40Active
explore listings in Ellenton
RECENT LISTINGS

Listing Provided By FINE PROPERTIES


Listing Provided By LOKATION

Ellenton Market Statistics
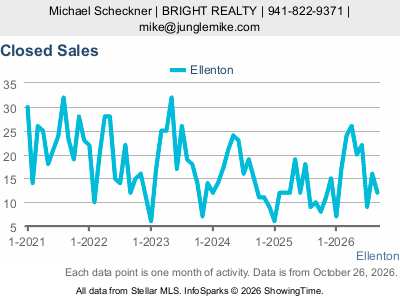
Explore the latest complete month of Ellenton city residential market data, with five years of monthly history. These live charts update automatically as Stellar MLS releases new data.
Closed Sales
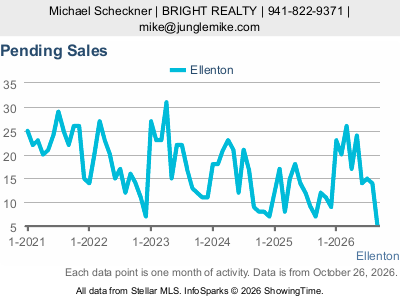
Pending Sales
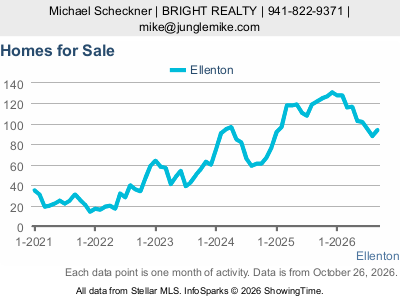
Homes for Sale
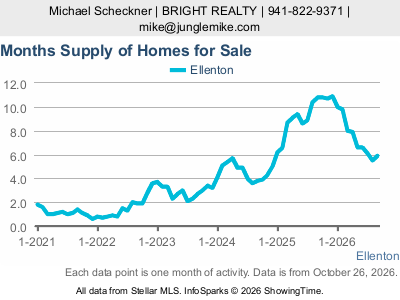
Months Supply
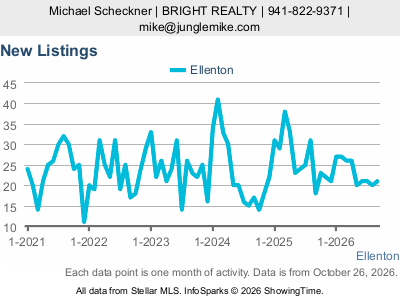
New Listings
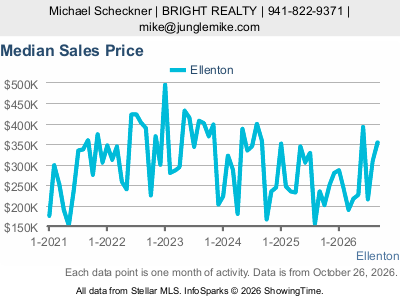
Median Sales Price
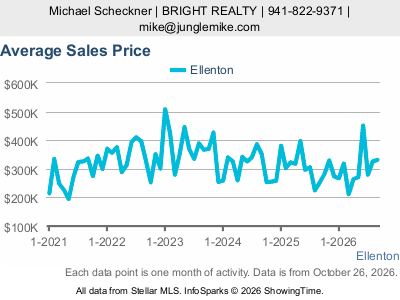
Average Sales Price
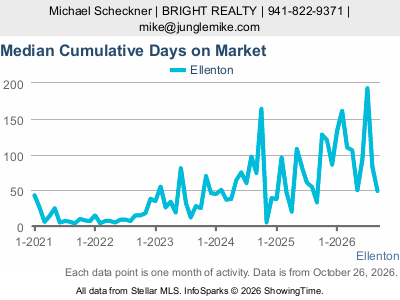
Median Cumulative Days on Market
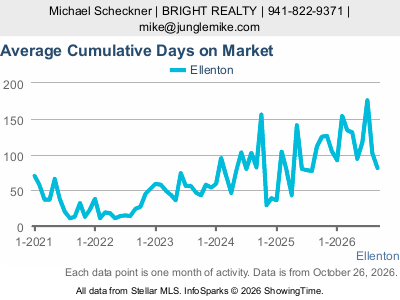
Average Cumulative Days on Market
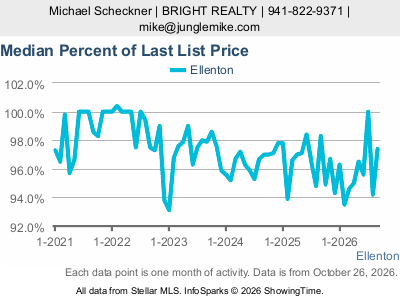
Median Percent of Last List Price
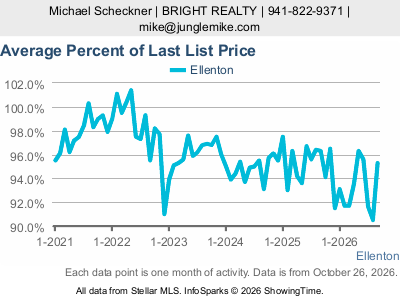
Average Percent of Last List Price
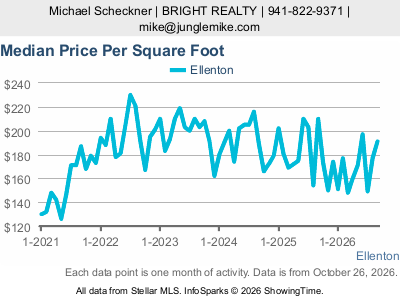
Median Sale Price Per Square Foot
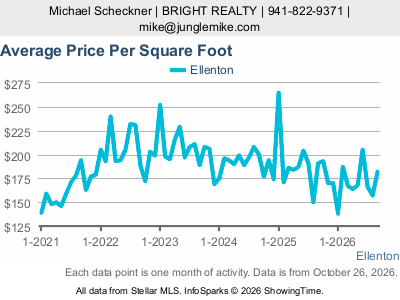
Average Sale Price Per Square Foot
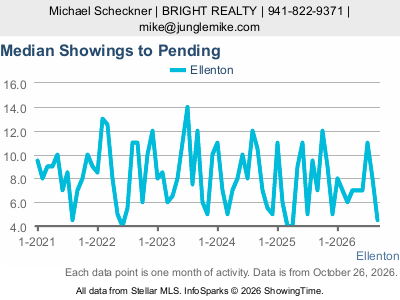
Median Showings to Pending
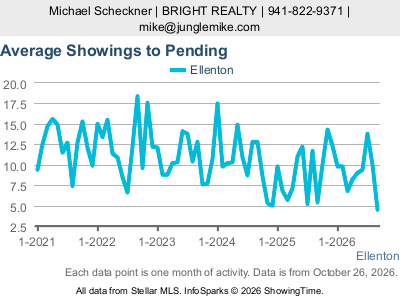
Average Showings to Pending
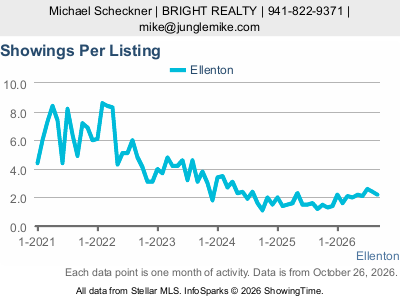
Showings Per Listing
Dollar Volume of Closed Sales
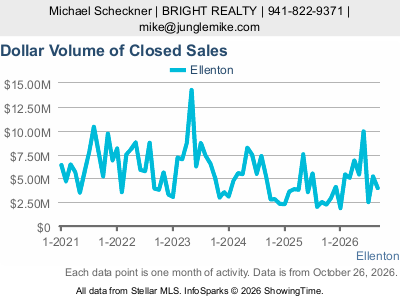
Source: Stellar MLS / InfoSparks by ShowingTime. Ellenton city; all available residential property types and price ranges. Each chart displays its current reporting period. CDOM means cumulative days on market. Sale-to-list percentages use the last list price. Showing activity reflects listings tracked by ShowingTime; showings-to-pending measures activity before a listing goes pending. Dollar volume is the total value of closed sales. These measures differ from the former SmartCharts gauges.
MARKET TRENDS

housing detail

Coming Soon
Listing Detail
Nearby Locations
2422 63RD AVE E, Ellenton, FL 34222
3 Beds 2 Baths 1,732 SqFt
Single Family Home
Listed by Matthew Pertosoff ANCHOR DOWN REAL ESTATE
3009 61ST DR E, Ellenton, FL 34222
4 Beds 3 Baths 2,258 SqFt
Single Family Home
Listed by Peggy Christ BEE GREEN REALTY, LLC720 IXORA AVE, Ellenton, FL 34222
3 Beds 2 Baths 1,857 SqFt
Single Family Home
Listed by Jessica Uglik, PLLC KW SUNCOAST818 NANCY GAMBLE LN, Ellenton, FL 34222
5 Beds 4 Baths 4,282 SqFt
Single Family Home
Listed by Jeremy Egglefield PREFERRED SHORE LLC3405 FLORENCE DR, Ellenton, FL 34222
2 Beds 1 Bath 540 SqFt
Other Types
Listed by Adam Lester DALTON WADE INC3309 BERNADETTE DR, Ellenton, FL 34222
2 Beds 2 Baths 1,100 SqFt
Other Types
Listed by Melissa Jo Moore, PLLC LESLIE WELLS REALTY, INC.3129 61ST TER E, Ellenton, FL 34222
3 Beds 2 Baths 1,693 SqFt
Single Family Home
Listed by Jaryd Hearn FINE PROPERTIES6011 FRENCH CREEK CT, Ellenton, FL 34222
4 Beds 4 Baths 2,925 SqFt
Single Family Home
Listed by Mireya Nunez PREFERRED SHORE LLC105 MEADOW CIR, Ellenton, FL 34222
2 Beds 2 Baths 1,056 SqFt
Other Types
Listed by Joseph Pickett LARU BEYA REAL ESTATE COMPANY INC67 MEADOWLARK CIR, Ellenton, FL 34222
2 Beds 2 Baths 1,518 SqFt
Other Types
Listed by Myrna Ryan WAGNER REALTY178 OSPREY CIR, Ellenton, FL 34222
2 Beds 2 Baths 1,100 SqFt
Other Types
Listed by Jennifer Flores, PLLC LESLIE WELLS REALTY, INC.5514 69TH PL E, Ellenton, FL 34222
4 Beds 3 Baths 2,492 SqFt
Single Family Home
Listed by Nancy Graham LESLIE WELLS REALTY, INC.42 MEADOWLARK CIR, Ellenton, FL 34222
2 Beds 2 Baths 1,394 SqFt
Other Types
Listed by Mike Faber THE KEYES COMPANY - SARASOTA3104 DARNEA LN, Ellenton, FL 34222
3 Beds 2 Baths 732 SqFt
Other Types
Listed by Nicole Sampson RE/MAX ALLIANCE GROUP4 MEADOWLARK CIR, Ellenton, FL 34222
2 Beds 2 Baths 1,296 SqFt
Other Types
Listed by Joseph Pickett LARU BEYA REAL ESTATE COMPANY INC3519 70TH AVE E, Ellenton, FL 34222
3 Beds 2 Baths 1,485 SqFt
Other Types
Listed by Scott Nivens EXIT KING REALTY15 MEADOWLARK CIR, Ellenton, FL 34222
3 Beds 2 Baths 1,300 SqFt
Other Types
Listed by Joseph Pickett LARU BEYA REAL ESTATE COMPANY INC3329 EILEEN DR, Ellenton, FL 34222
2 Beds 2 Baths 1,096 SqFt
Other Types
Listed by Jim Hegemier LESLIE WELLS REALTY, INC.4609 10TH STREET CT E, Ellenton, FL 34222
2 Beds 2 Baths 864 SqFt
Other Types
Listed by Dave Hoyt FUTURE HOME REALTY INC3903 DAY BRIDGE PL, Ellenton, FL 34222
3 Beds 3 Baths 1,624 SqFt
Single Family Home
Listed by Domanic Calamese KW COASTAL LIVING III
Commute Score
Coming Soon
demographics
Population
Density
Households
Gender
Coming Soon
Education
Coming Soon
Coming Soon
Coming Soon
Coming Soon

GET MORE INFORMATION